
Web Lead
Loblaw Perfect Experience
Cross-platform OpenTelemetry SDK adopted org-wide at Loblaw, streaming enriched traces to Grafana and Tempo.
Client: Loblaw Digital via TELUS Digital
Year: 2024
Team: 4
Built Loblaw Digital's first shared observability layer.
Multi-LOB
Adoption across Loblaw Digital lines of business
Latency diagnostics delivered org-wide
WD.2 / Figure //
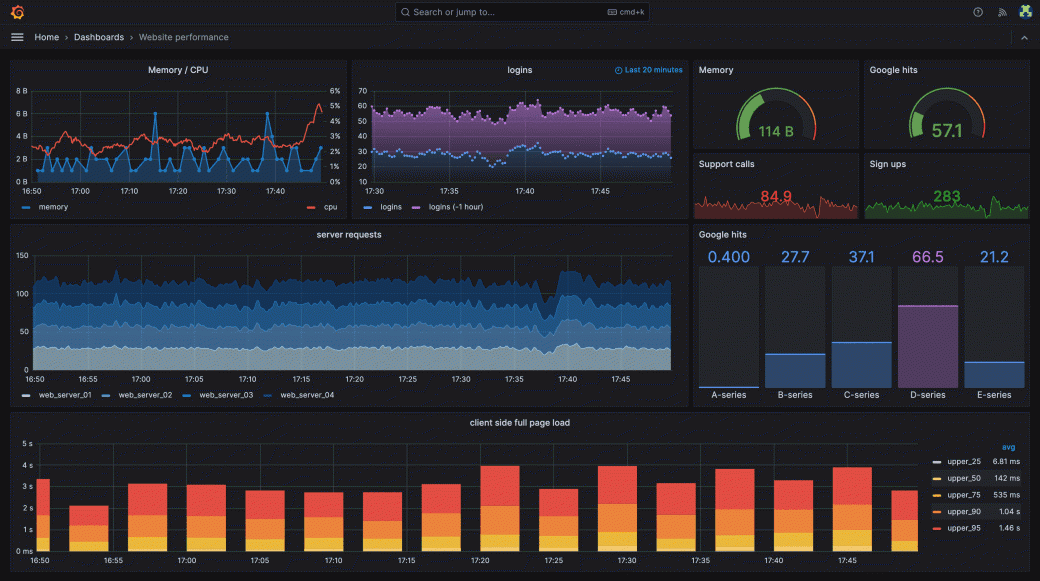
Grafana Dashboard Proof of Concept
Defined the SDK architecture, data flow, and Grafana proof of concept that made the observability program concrete for Loblaw Digital leaders. The dashboard turns raw OpenTelemetry output into operational signals such as memory pressure, request throughput, signups, and client-side load percentiles, giving multiple lines of business a shared language for performance.
WD.3 / Figure //
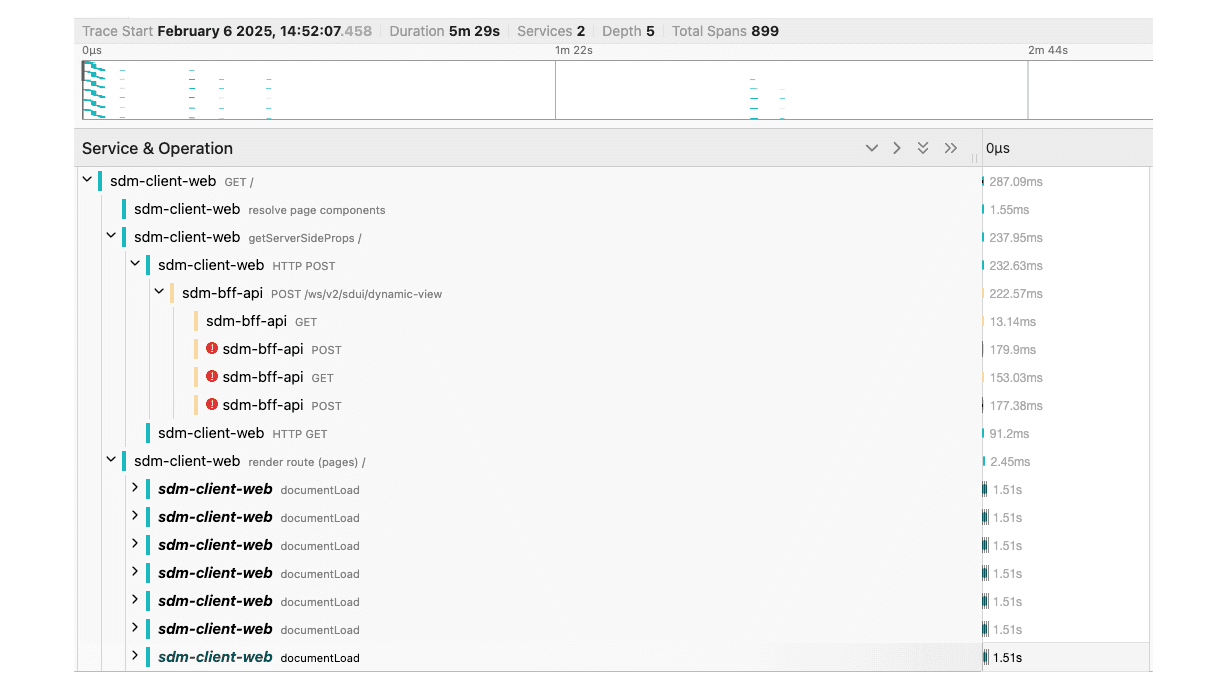
Distributed Trace Diagnostics
Built the trace-enrichment layer that carries useful state across server rendering, browser work, and BFF calls in divergent Next.js applications. The trace view is the evidence: nested operations, service boundaries, span timing, and error points become visible without forcing every line of business to reinvent instrumentation.
WD.4 / Figure //
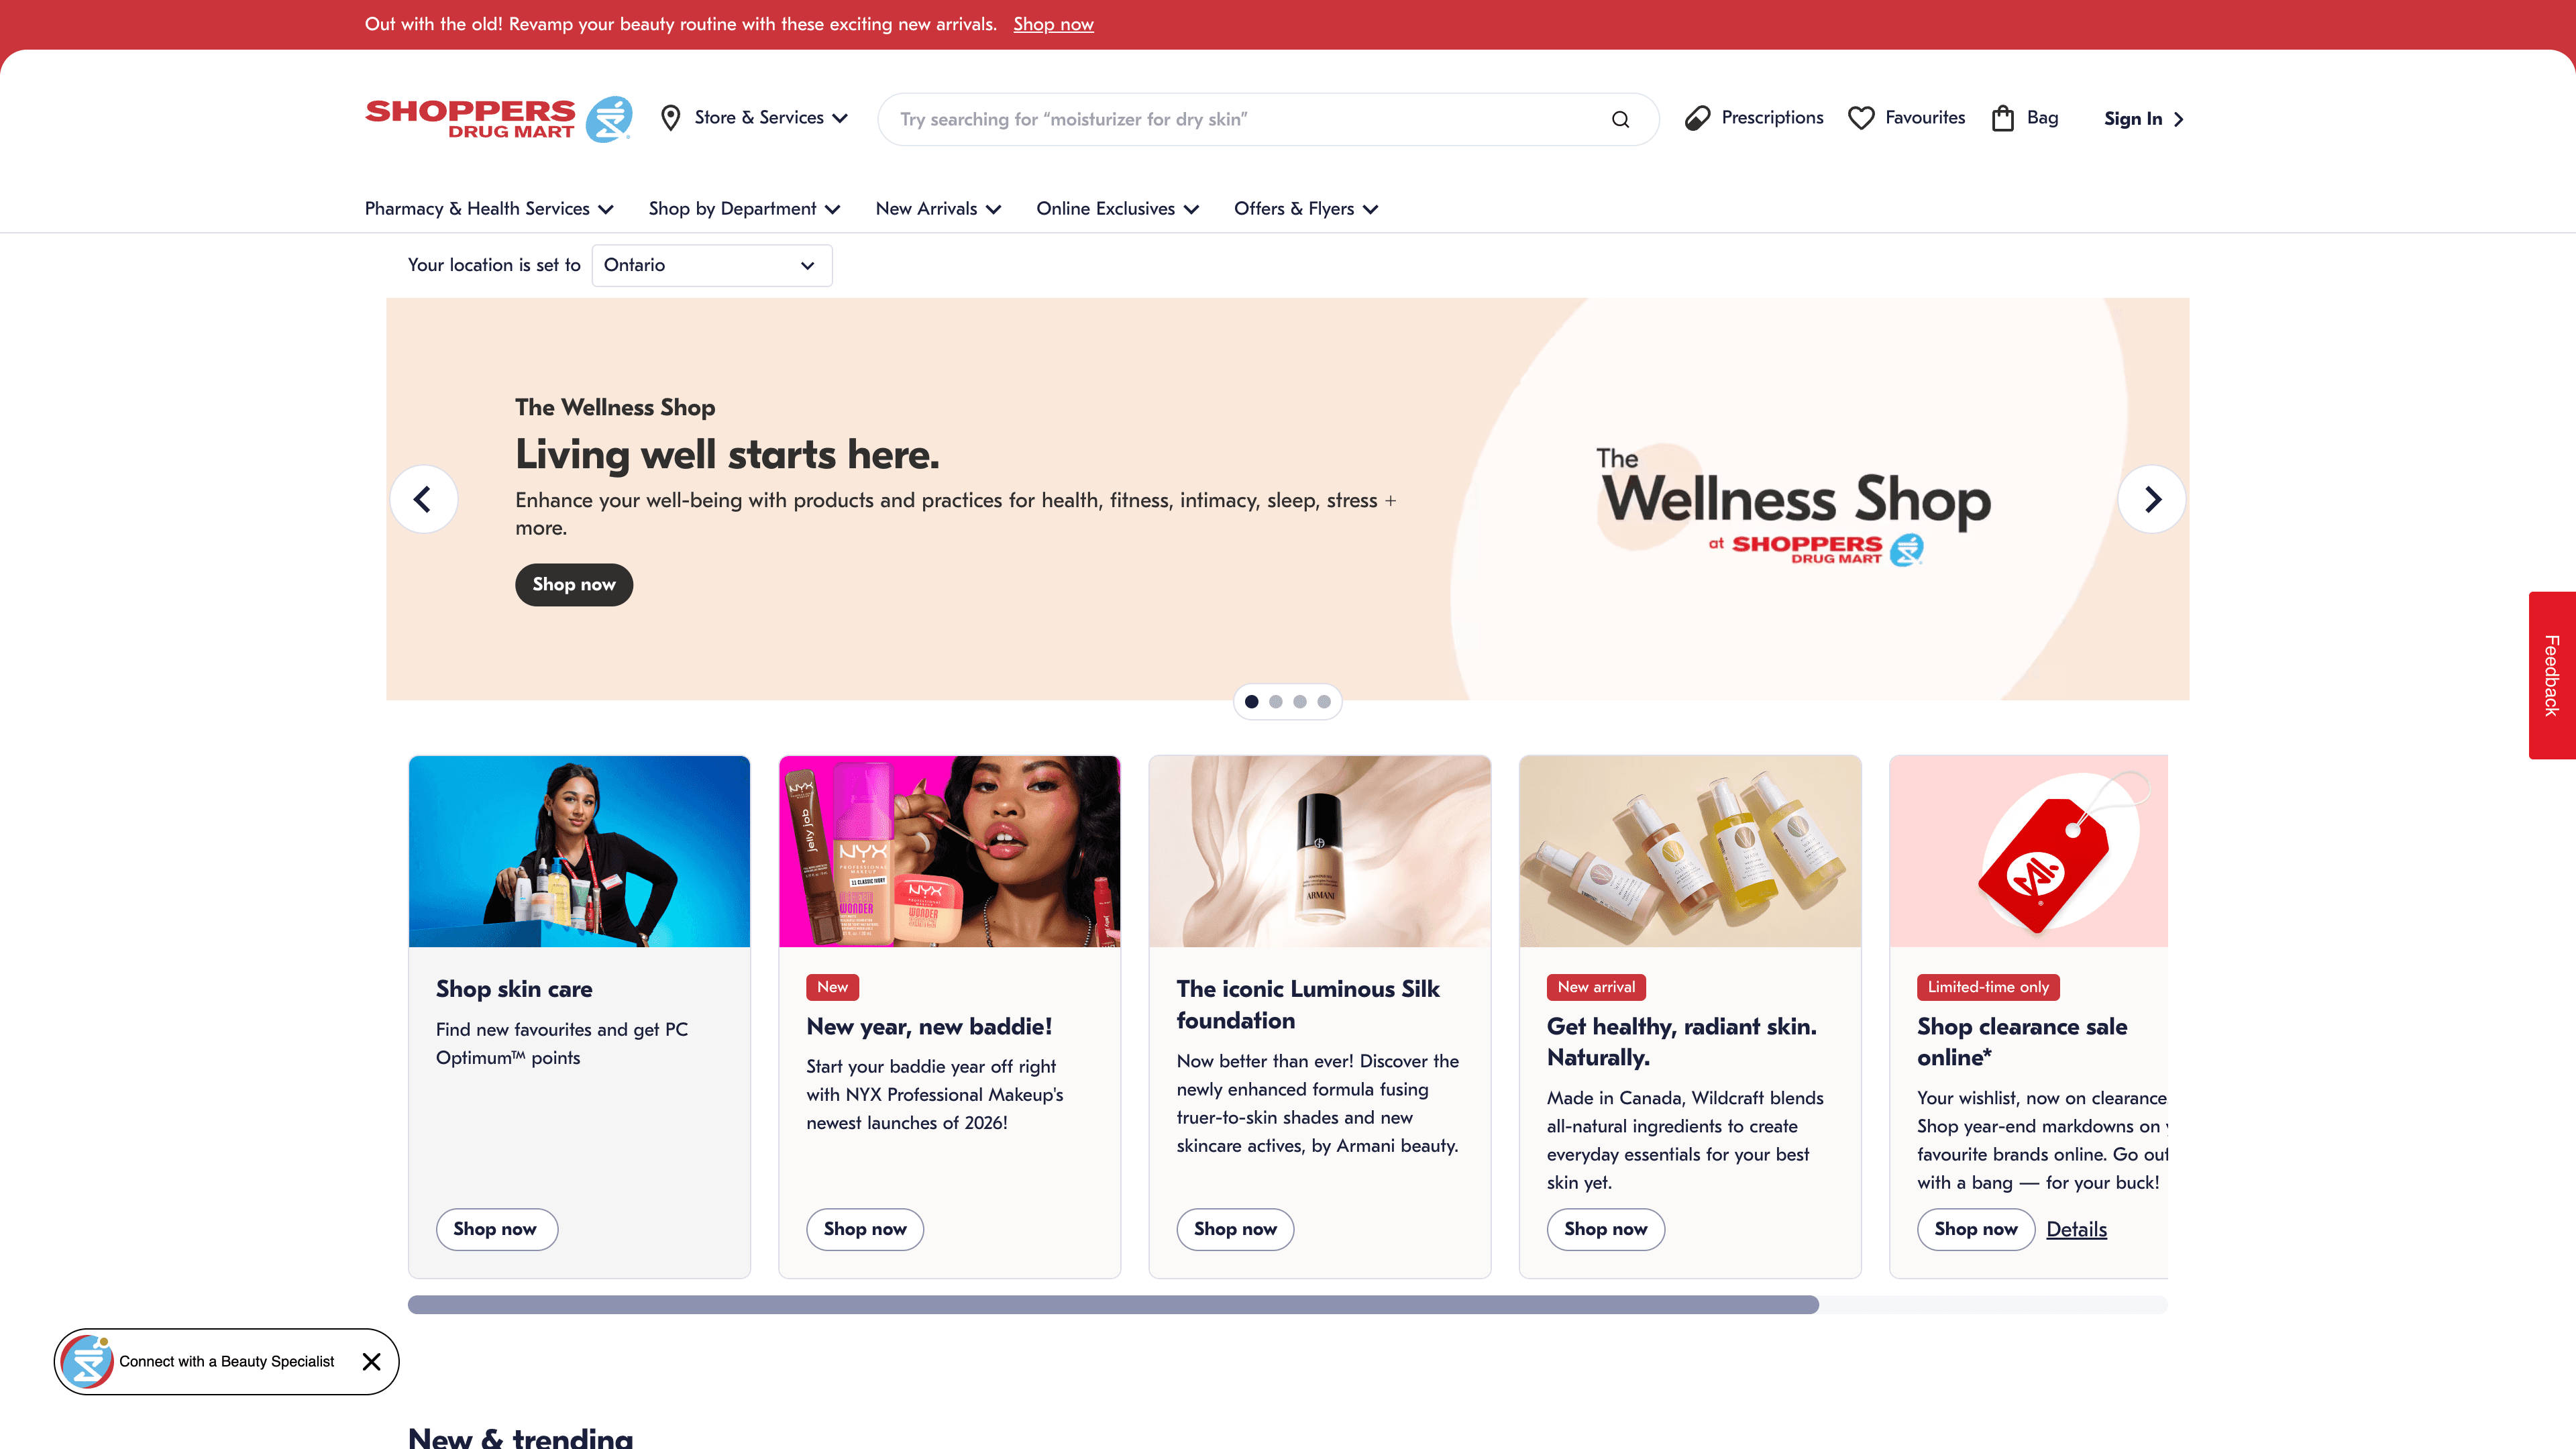
Storefront Instrumentation at Scale
Shaped the SDK around real commerce surfaces instead of a clean-room demo: divergent Next.js versions, browser and server runtimes, and line-of-business requirements all had to fit one instrumentation model. The Shoppers storefront anchors the story because it proves the abstraction on a production-scale experience with frontend performance, traces, errors, and SLO signals flowing into VictoriaMetrics, Tempo, and Grafana.
Get in Touch
I'm based in Toronto, Canada. Open to roles where engineering and product need to work closely together.